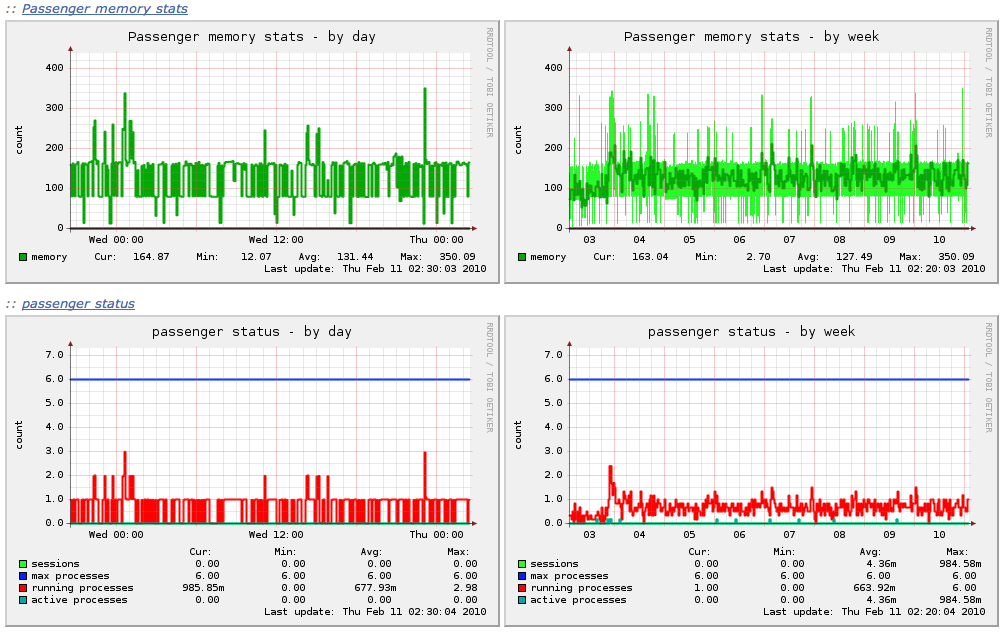
Munin the monitoring tool surveys all your computers and remembers what it saw. It presents all the information in graphs through a web interface. Its emphasis is on plug and play capabilities. After completing a installation a high number of monitoring plugins will be playing with no more effort.
Using Munin you can easily monitor the performance of your computers, networks, SANs, applications, weather measurements and whatever comes to mind. It makes it easy to determine “what’s different today” when a performance problem crops up. It makes it easy to see how you’re doing capacity-wise on any resources.

Munin uses the excellent RRDTool (written by Tobi Oetiker) and the framework is written in Perl, while plugins may be written in any language. Munin has a master/node architecture in which the master connects to all the nodes at regular intervals and asks them for data. It then stores the data in RRD files, and (if needed) updates the graphs. One of the main goals has been ease of creating new plugins (graphs).


